Performance: A New High Watermark
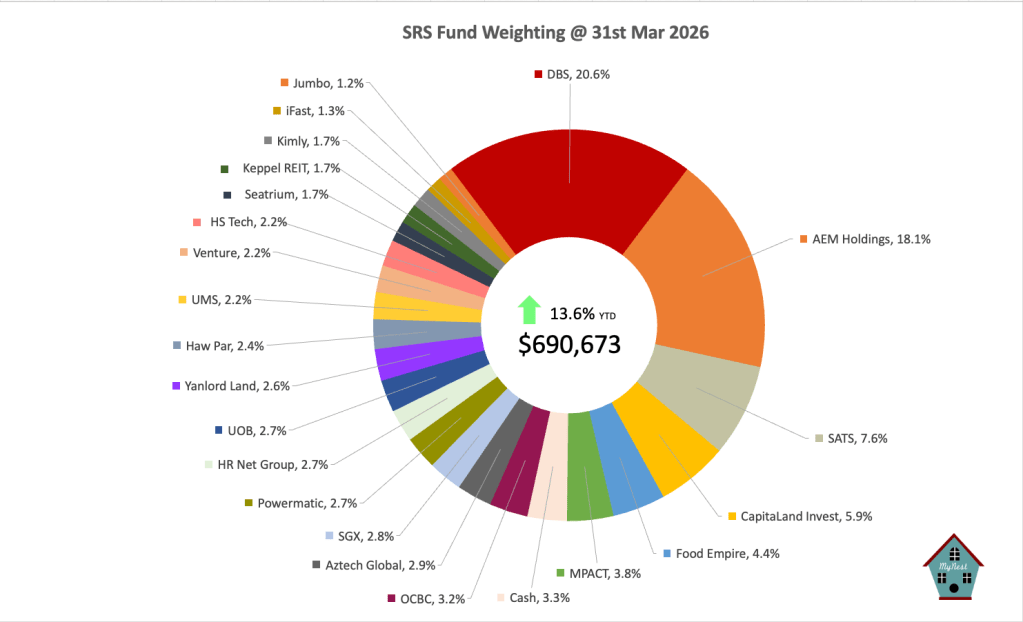
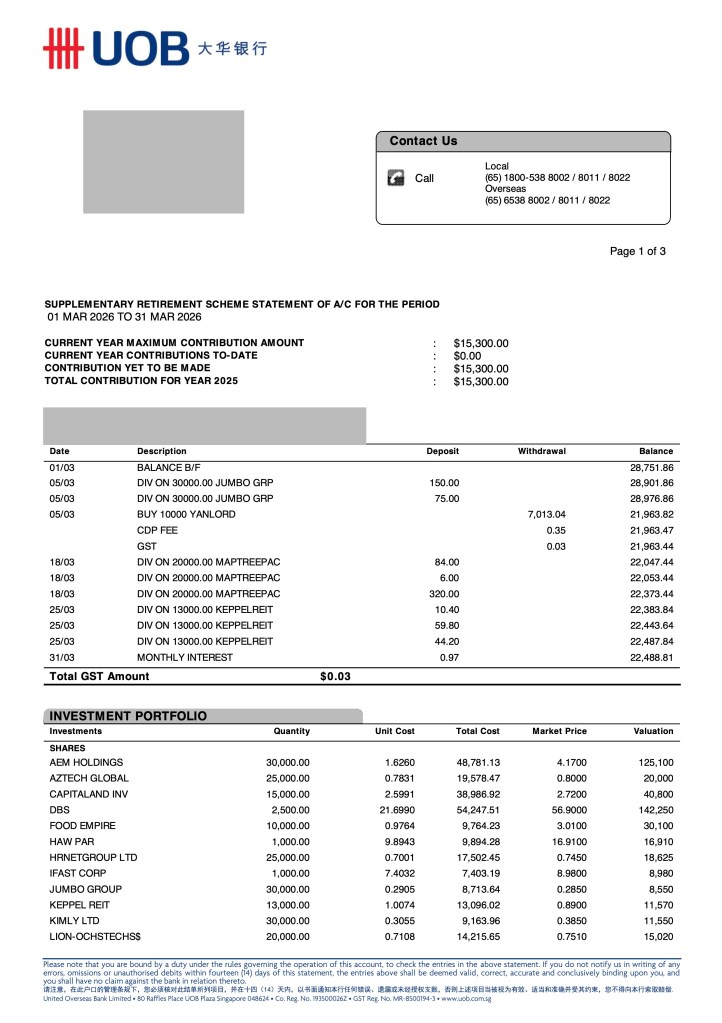
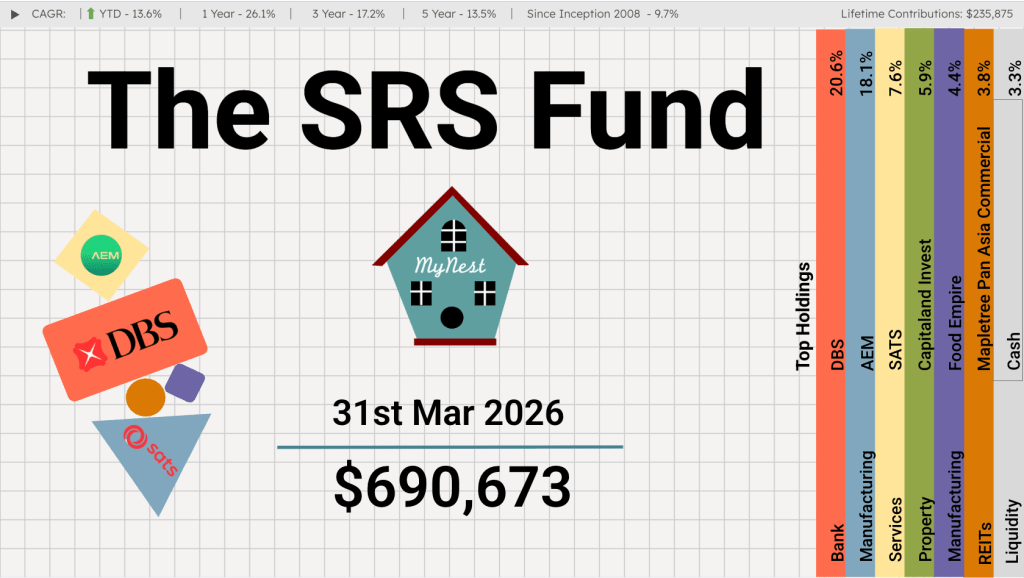
It is an enduring market reality that a concentrated minority of holdings drives the vast majority of returns. For years, DBS (currently the largest individual holding at 20.6%) has served as the compounding engine of the SRS Fund. However, in the month of March, that momentum shifted decisively. AEM Holdings was the undisputed driver of this month’s outperformance. As discussed in previous updates, AEM’s fortunes have reversed dramatically, supercharged by the global surge in demand for high-end AI hardware.
Sector Divergence: Manufacturing Takes the Crown
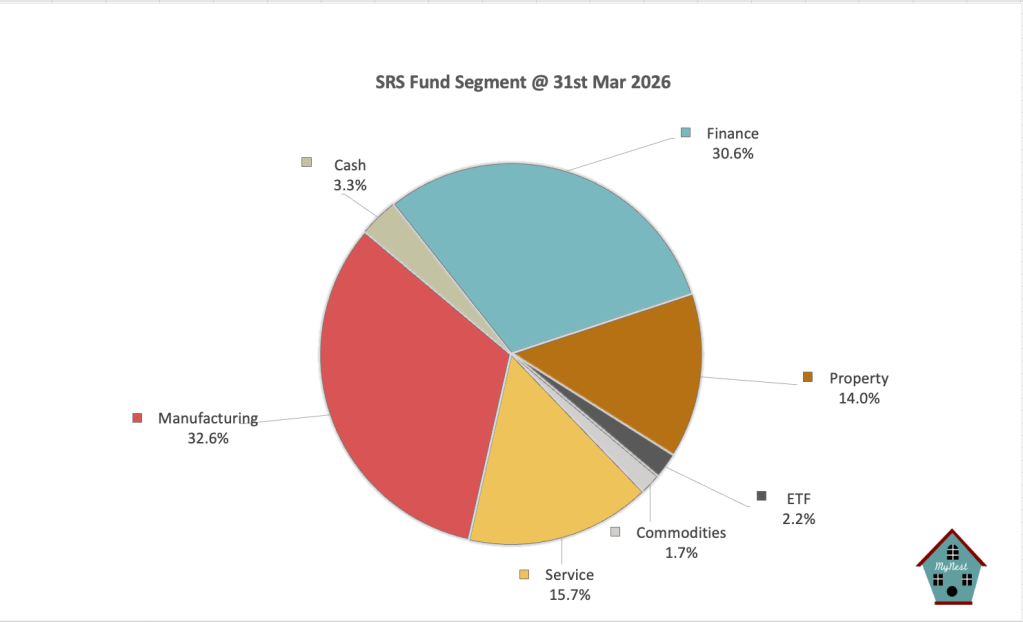
As the market aggressively reprices AEM’s improving business fundamentals, the stock has swelled to constitute 18.1% of the total portfolio. Supported by our positions in UMS, Venture, and Aztech Global, this has triggered a historic milestone: for the very first time since the fund’s inception in 2008, our Manufacturing segment (32.6%) has eclipsed our Finance segment (30.6%).
This structural pivot has profound implications. It marks a stark divergence between the SRS Fund and our benchmark, the STI Index, which remains heavily anchored to traditional banking. The SRS Fund is thus actively trading traditional yield for secular tech growth.
Macro Risks: Gathering Clouds
While the portfolio celebrates record highs, severe macroeconomic headwinds are forming globally. The escalating conflict in Iran and the potential blockage of the Strait of Hormuz threaten to severely disrupt the crude oil supplies that Asia relies upon. More acutely, Singapore depends heavily on Qatari natural gas to power the nation.
With no immediate end to this conflict in sight, regional businesses must brace for margin compression. A sustained spike in energy costs will inevitably ripple through every sector—and our newly dominant, energy-intensive manufacturing segment is heavily exposed. The business outlook is cloudier than it has been in years, and I am entirely prepared for the SRS Fund to retreat from these highs and encounter sharp volatility.
SRS Fund Performance vs. Benchmark
The SRS Fund reached yet another all time high milestone this month, with the total value hitting $690,673. In fact it reached the $700k level for the first time during the month before settling at this lower level.
Performance Comparison
The SRS Fund is currently outperforming the benchmark Straits Times Index (STI). I am starting to see the divergence of the SRS Fund and the STI Index even in its largest holding. While the SRS Fund had not divested any of its DBS Holdings, its weighting continues to fall compared to that in the STI Index.
| Metric | The SRS Fund | STI Index (Benchmark) |
| YTD Return (Mar 2026) | +13.6% | ~+5.6% |
| Cash Weighting | 3.3% | N/A |
| Top Holding | DBS (20.6%) | DBS (~25.4%) |
Why We Are Outperforming
The Straits Times Index (STI) has long been the default yardstick for Singaporean investors, characterized by its reliable yields and heavy concentration in traditional financial institutions. However, closing out the first quarter of 2026, a stark performance gap has emerged: the SRS Fund has posted a year-to-date return of 13.6%, eclipsing the STI’s 5.6%.
This outperformance is not a byproduct of random market fluctuations. It is the direct result of a deliberate, structural divergence in portfolio allocation. The SRS Fund is pulling away from the benchmark because it has fundamentally shifted its growth engine from traditional finance to secular technology and manufacturing.
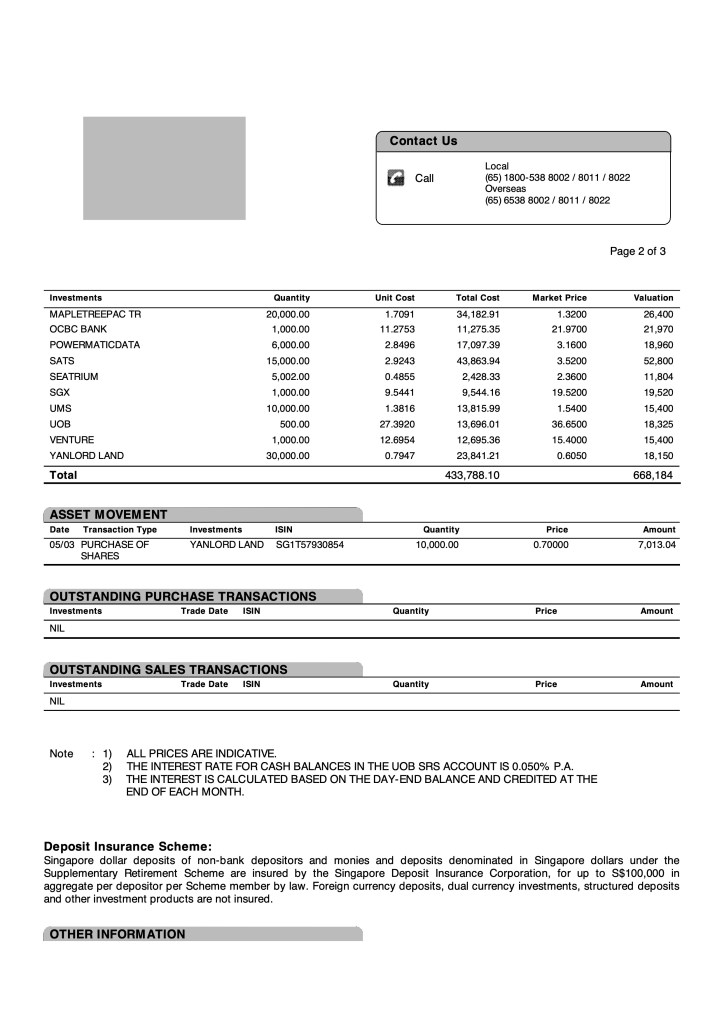
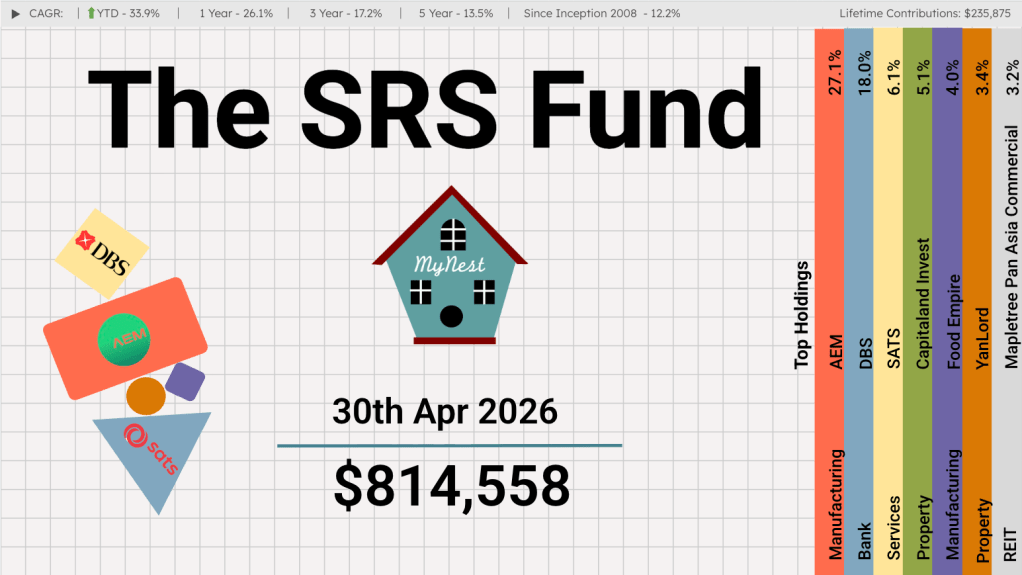
Portfolio Segments
The Tech Takeover
The most defining characteristic of the SRS Fund at the end of Q1 2026 is the historic inversion of its core sectors. For the first time since 2008, Manufacturing (32.6%) has dethroned Finance (30.6%) as the heaviest allocation. While Services (15.7%) and Property (14.0%) continue to play supporting roles, the fund’s DNA has fundamentally mutated. It has transformed from a traditional, yield-focused banking portfolio into a more aggressive, semiconductor-heavy growth vehicle.
Dividends: A Strategic Trade-Off for Growth
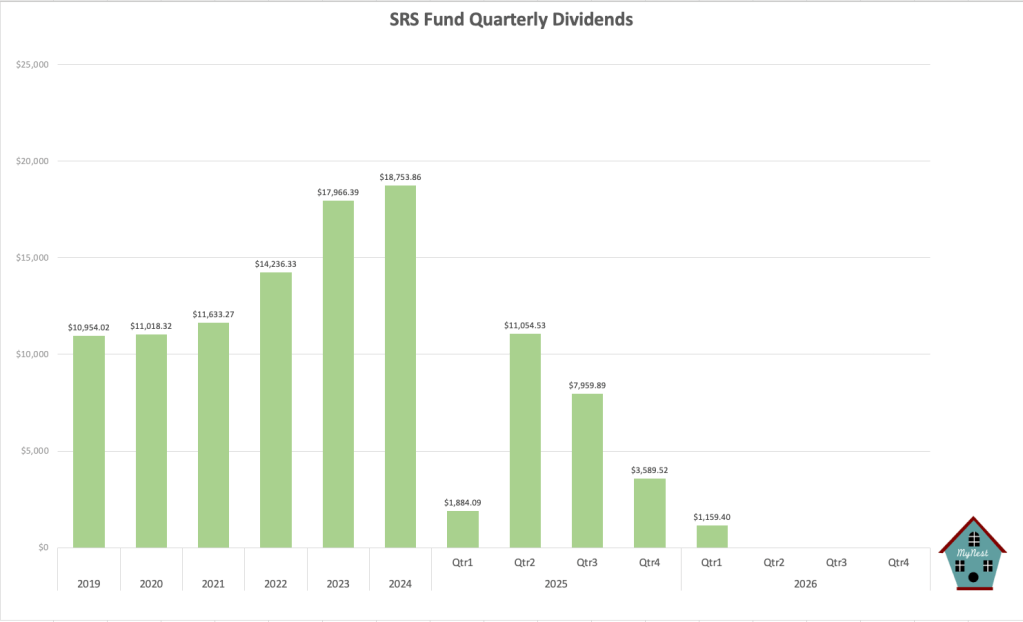
A quick glance at the latest dividend chart reveals a noticeable year-over-year contraction: Q1 2026 delivered $1,159.40, trailing the $1,884.09 collected in Q1 2025, and sitting far below the fund’s historical quarterly peaks. For an audience accustomed to traditional yield, this drop might initially raise eyebrows.
However, this contraction is not a symptom of underlying weakness; it is a deliberate, engineered outcome.
By strategically pivoting the SRS Fund away from traditional, high-yield finance and property segments toward tech-heavy manufacturing, the cash flow profile was fundamentally altered. Companies operating at the bleeding edge of semiconductor and AI hardware cycles do not prioritise aggressive dividend payouts. Instead, they operate on a model of aggressive capital retention.
It is crucial to understand that this “uncollected” dividend is not lost wealth. It is retained earnings. These tech companies are internally reinvesting that capital into R&D and capacity expansion to capture exponential future growth.
Despite this structural shift, my projections indicate that total dividend collections for 2026 will remain comparatively similar to last year’s overall figures. The current discrepancy is largely a matter of scheduling. The payout timelines for the newly weighted manufacturing holdings simply follow a different seasonal rhythm than the banking sector, deferring the cash flow rather than destroying it.
SRS Fund Value
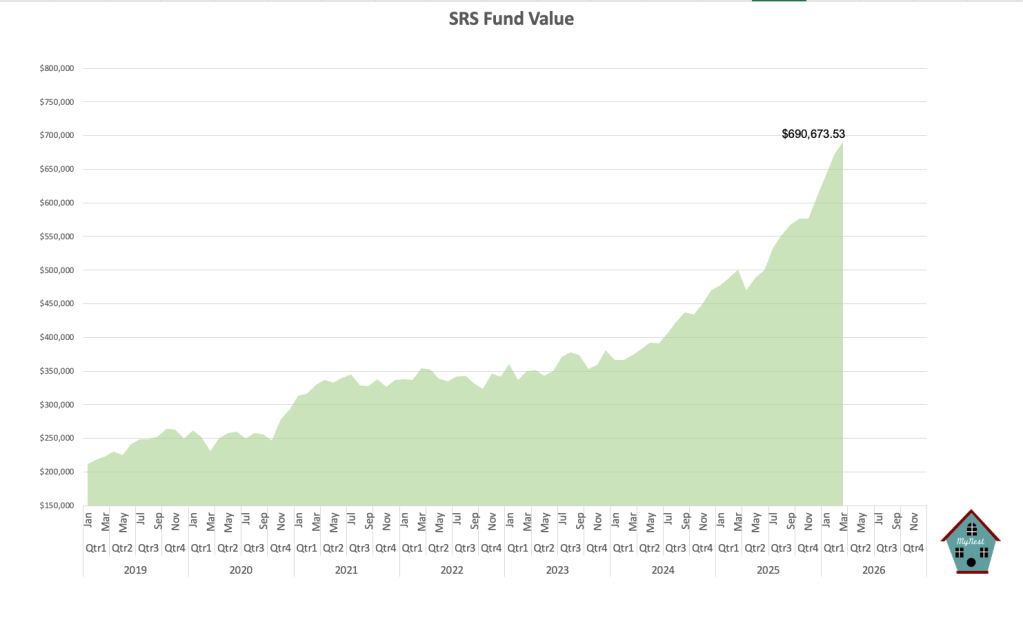
The SRS Fund closed the first quarter of 2026 at an unprecedented all-time high of $690,673.53. However, a critical examination of the growth curve reveals a stark reality: the trajectory since late 2024 has become nearly parabolic.
For much of the 2021–2023 period, the fund’s value consolidated in a prolonged, steady-state plateau in the mid-$300,000 range. The recent vertical explosion is mainly attributed to the concentrated pivot into high-beta tech hardware.
While this aggressive expansion is the engine behind the current record valuation, it represents a substantial deviation from the SRS fund’s historical compounding rhythm. Parabolic ascents are rarely sustainable indefinitely.
I do recognise that this elevated valuation leaves the portfolio acutely exposed; defending this peak against the macroeconomic gravity of inflation and geopolitical tensions will be one challenging test in the coming quarters.
Cash Levels
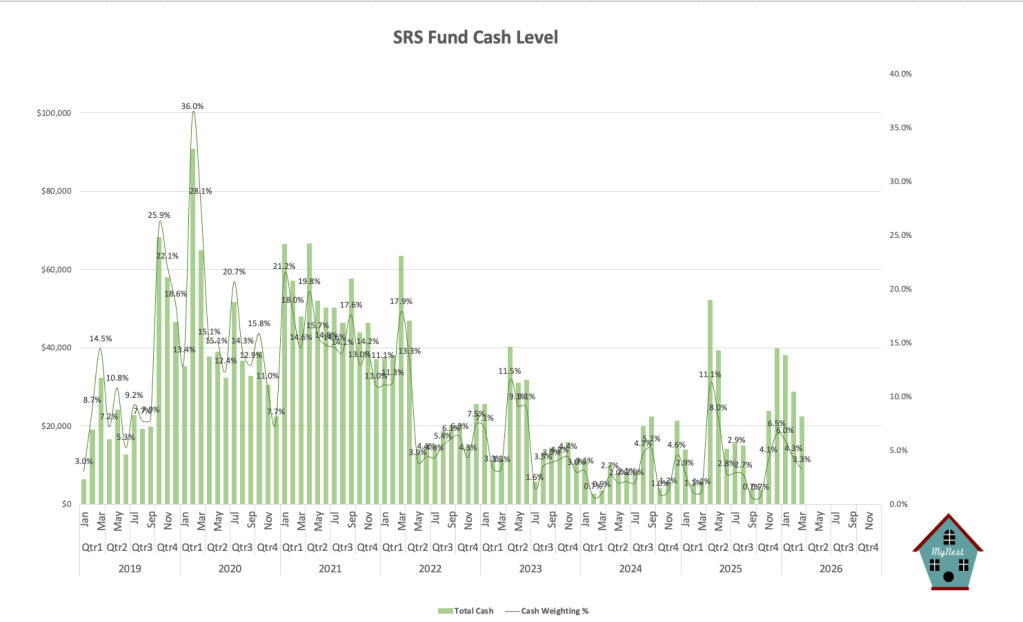
As of the end of March 2026, the SRS Fund’s cash weighting has dwindled to just 3.3%—one of the lowest liquidity points in the portfolio’s history. While being fully deployed has allowed the fund to maximize the upside of the recent tech-driven rally, it leaves the portfolio somwhat exposed.
Looking ahead, the fund’s cash position will organically replenish. Projected dividend collections throughout the rest of the year are expected to add approximately 3% to our reserves, while scheduled SRS contributions will inject an additional 2%. If market conditions present no compelling opportunities to deploy capital, the SRS Fund cash weighting will steadily rebuild to roughly 8% by year-end, successfully reloading the dry powder for the next cycle.
-

The SRS Fund May 2026
Korea, powered by the worldwide shortage and surge in memory demand, was hit directly by the AI wave, with its stock market more than doubling in a matter of 5 months. Taiwan, already the world’s most important advanced chip manufacturing hub has risen to become one of the largest stock market globally.
-

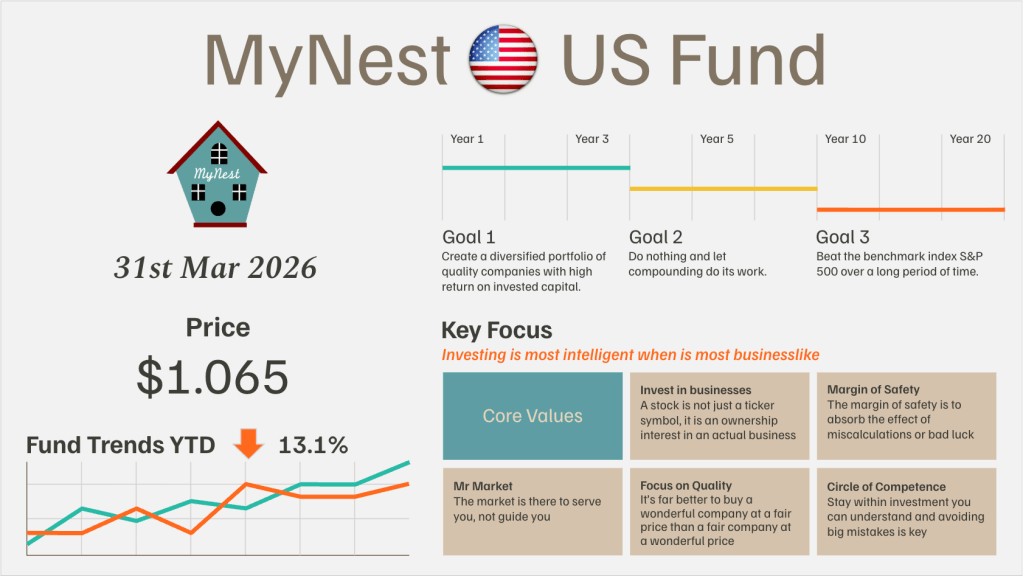
MyNest US Fund May 26
May has been an incredibly illuminating month for the MyNest US Fund. Looking across the broader landscape, the S&P 500 Index has continued its steady leg up, gaining +5.15% in the month of May alone to push its Year-to-Date (YTD) gain to +10.73%.
-
The SRS Fund Apr 2026
In my investment journey, there have been three occasions where I witnessed a company deliver a 10x return.
-

MyNest US Fund Apr 26
The market rebounded strongly in April as investors appeared to look past geopolitical uncertainty and renewed their focus on earnings, artificial intelligence, and the long-term growth prospects of quality businesses.
-
The SRS Fund Mar 2026
It is an enduring market reality that a concentrated minority of holdings drives the vast majority of returns. For years, DBS (currently the largest individual holding at 20.6%) has served as the compounding engine of the SRS Fund.
-
MyNest US Fund Mar 26
March shattered any lingering market complacency, pivoting sharply from the localized damage of the “SaaS-pocalypse” to a systemic shock driven by the war in Iran.
