
Dear Investors,
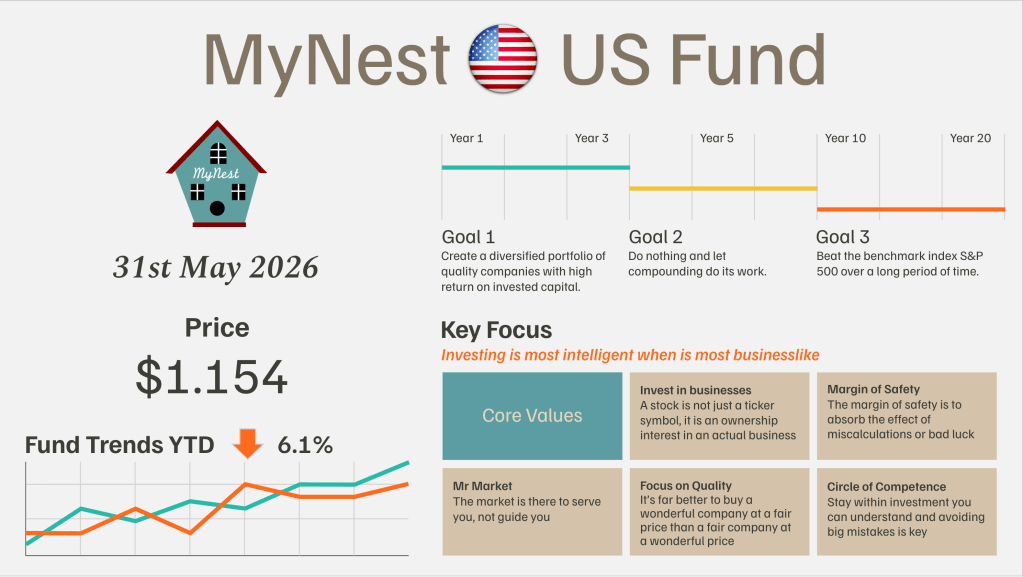
May has been an incredibly illuminating month for the MyNest US Fund. Looking across the broader landscape, the S&P 500 Index has continued its steady leg up, gaining +5.15% in the month of May alone to push its Year-to-Date (YTD) gain to +10.73%.
In contrast, our portfolio of businesses experienced a cooling off, ticking down -0.95% for the month, which bring our YTD performance to -3.48%. This divergence is clearly visible in our core portfolio performance tracking graph.
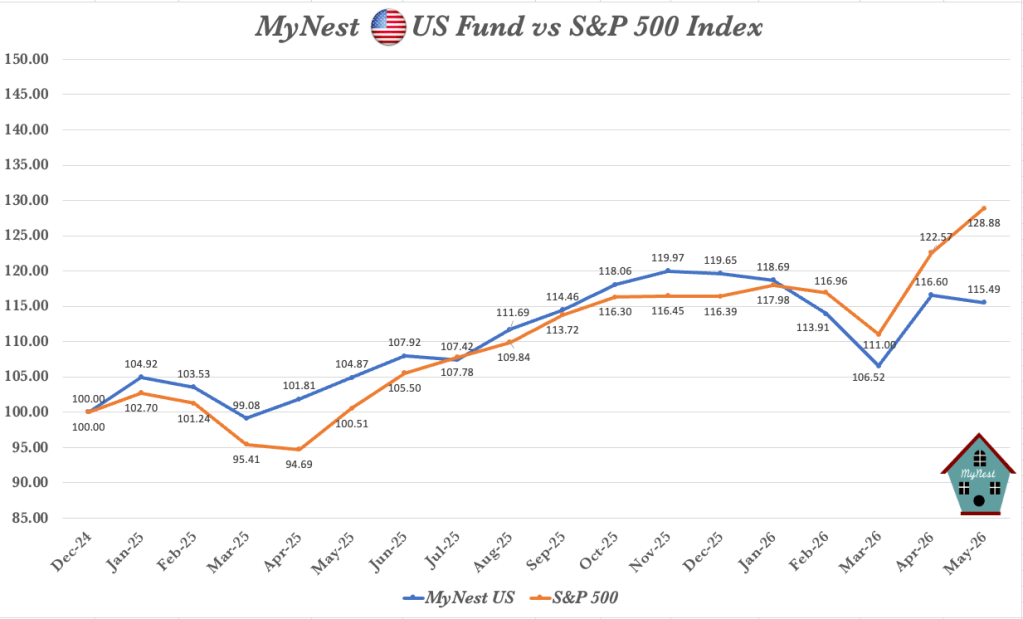
Whie a widening underperformance gap against a roaring index certainly prompt short-term unease, analysing this divergence using a systematic analysis clarifies the long-term mechanics of our high-conviction value investing.
The S&P 500 is structurally cap-weighted. This means it can be entirely distorted by a tiny group of massive businesses. In May, only 3 out of the 11 market sectors actually posted positive returns. The entire index was carried exclusively by the Information Technology sector, which surged an astonishing +15.9% in May alone. This is a textbook showcase of extreme market narrowness.
Leadership rotated so aggressively back to tech that only about 33% of stocks in the index actually beat the market. The rest of the stock market was quietly consolidating, explaining why our diversified fund ticked down -0.95% while the index floated higher.
The Companies Pushing the Index Higher
The names driving this vertical expansion are businesses riding the absolute tidal wave of generative AI infrastructure buildouts. Goldman Sachs reported that cloud hyperscalers have officially raised their combine 2026 capital expenditure forecasts to a staggering $670 billion to build data centers, chips and power infrastructure.
Did We Miss Out on Improving Fundamentals?
To answer this rationally, let’s process the situation using our core frameworks:
Circle of Competence & Intrinsic Value
We explicitly own the absolute finest tollbooths of this infrastructure boon. Through our massive 22.01% stake in Alphabet, our 4.12% position in Amazon (AWS), and our core software holdings like Adobe (3.95%), Intuit, Constellation Software and Salesforce, we are capturing the ultimate downstream value of this $670 billion hardware spend.
It was a deliberate decision to own entities providing the software ecosystem and cloud computing architecture, rather than trading highly cyclical hardware components makers like Super Micro, Dell or Micron. Alphabet’s $400b backlog and 60%+ cloud growth prove that our fundamentals are expanding just as powerfully – the market is simply choosing to assign a vertical price multiple to hardware suppliers this month.
The Great Divergence – Price Action vs Business Realities
This stark contrast in price performance is flatly opposed by the actual fundamental results of our investment holdings. While the stock tickers show our fund consolidating down –3.48% YTD, the engine room of our portfolio is humming with incredible efficiency. This earnings season has demonstrated that the stuctural competitive moats of the businesses we own are expanding, completely decoupled from near-term price volatility.
The Heavy Weights: Firing on All Cylinders
The operational strength of the portfolio is anchored by our top three high-conviction holdings, which together make up over 41% of our capital allocation as shown in our portfolio tree map:
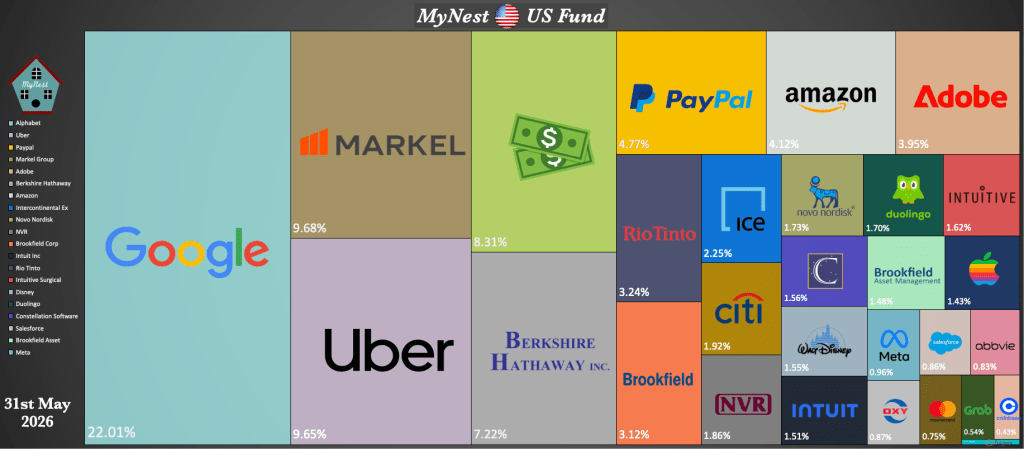
- Alphabet (22.01% Allocation): Our largest exposure led the portfolio’s business performance, firing on all cylinders. Alphabet’s results were powerfully driven by its Cloud segment, which achieved a spectacular growth rate of over 60%. This expanision is backed by a massive and growthing structural backlog of over $400b, cementing its dominant role in our Ads + Cloud sector weight.
- Markel Group & Berkshire Hathaway (16.9% Combine Allocation): Our core insurance engine delivered earnings that were perfectly in line with expectations. These compounding giants operate with high probity, maintaining a trajectory built to steadily grow intrinsic value at around 10% to 12% over time through disciplined underwriting and float deployment.
- Uber (9.65% Allocation): Our anchor transport position turned into a phenomenal quarter. Driven by the aggressive growth of its Uber One subscription model, Uber is rapidly evoloving into an “economy share” kind of business – locking in high-margin, recurring customer lifetime value and solidifying its competitive network effects.
Megacap Tech & SaaS
- Amazon (4.12% Allocation): Announced a remarkable strong set of results, driven heavily by the continued re-acceleration and structural scale of AWS.
- Apple (1.43% Allocation): Navigated a major milestone by annoucing a seamless CEO transition, while simultaneously delivering yet another record-breaking financial quarter to prove the absolute stickiness of its ecosystem.
- Meta (0.96% Allocation): Continues to put on an absolute clinic in operational monetisation,, blowing past Q1 expectations with an EPS of $7.31 vs $6.67 estimate, driven by robust ad inventory pricing and massive AI-driven distribution efficiencies.
- SaaS Compounders (7.88% Combine Allocation): The software companies we methodically acquired during recent market downturns are executing beautifully. Constellation Software delivered a stellar quarter, growing total revenue by 20% to $3.18 billion and surging its free cash flow available to shareholders by 44% to $733 million.Crucially, management weaponized this cash flow by deploying $697 million into new acquisitions and committing another $786 million subsequent to the quarter close. Alongside Constellation, Adobe (3.95%), Intuit (1.51%) and Salesforce (0.86%) continue to see intact operating margins, proving that their capital-light, recurring-revenue models are compounding cash flows reliably in the background
Segment Chart
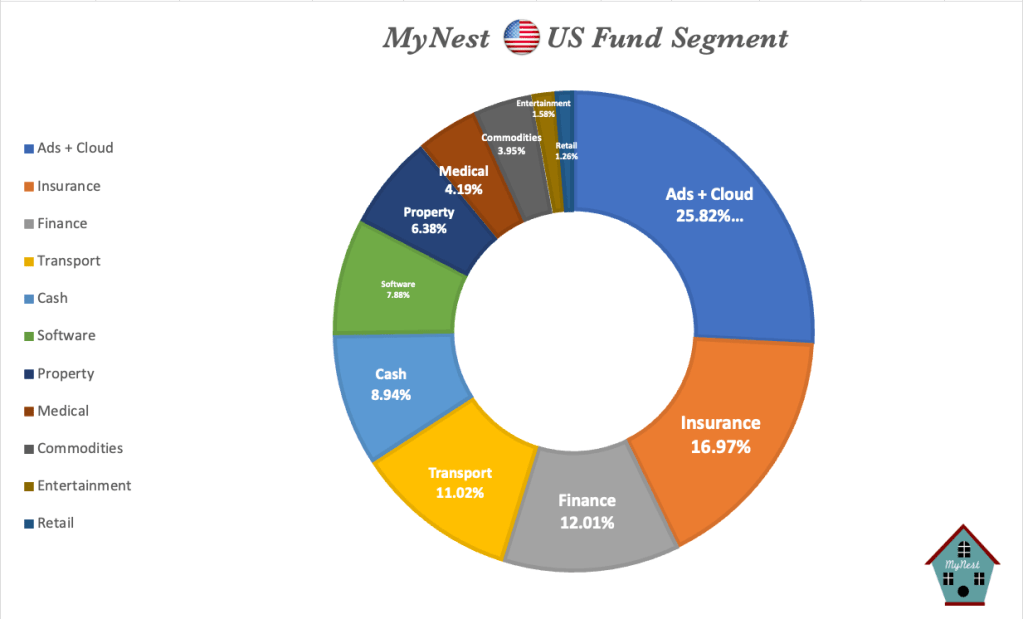
The allocations of our capital across core sectors, derived from our asset allocation donut chart, show a balanced but highly intentional layout.
As there were very little material change in the absolute mixed there is no need for further commentary. Going forward I would expect our cash holding to increase as increasing speculative activities continue to take hold in the stock market.
-
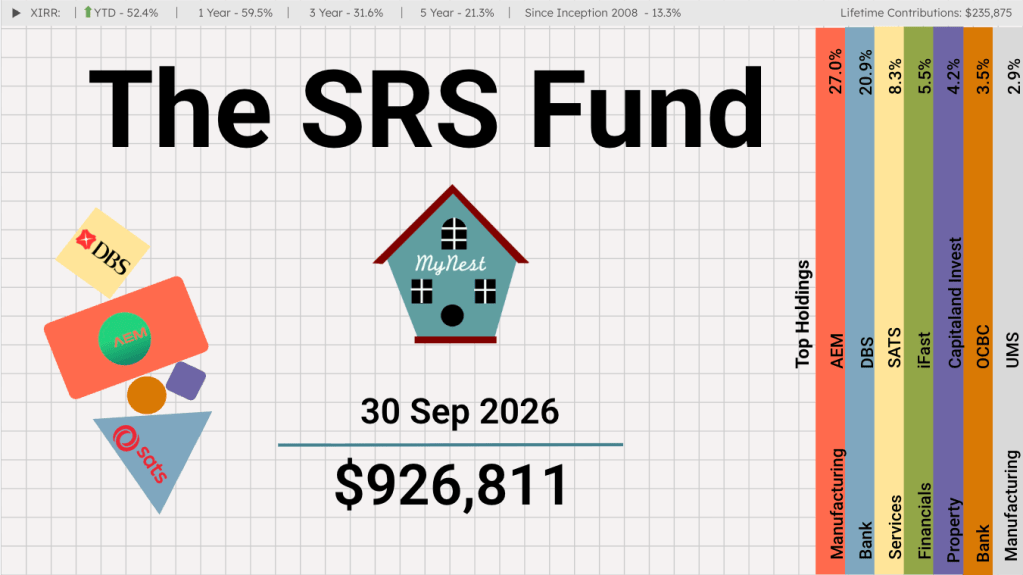
The SRS Fund Sep 2026
Sep brought a modest recovery in the SRS Fund, but it also left me thinking more carefully about how much of Singapore’s current economic and market strength is connected to the AI investment cycle.
-
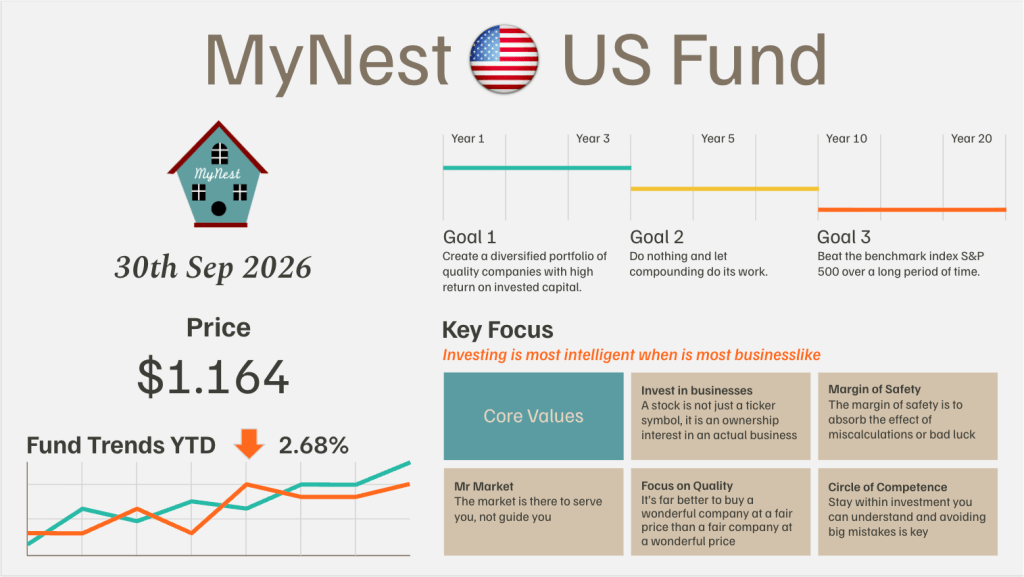
MyNest US Fund Sep 26
The month of Sep brought together two developments that matter to our portfolio: Further progress in the field of AI and a sharp increase in long-term interest rates.
-

The SRS Fund Aug 2026
Aug’s economic update provided another reminder of how closely Singapore has become connected to the global investment in AI and semiconductors.
-
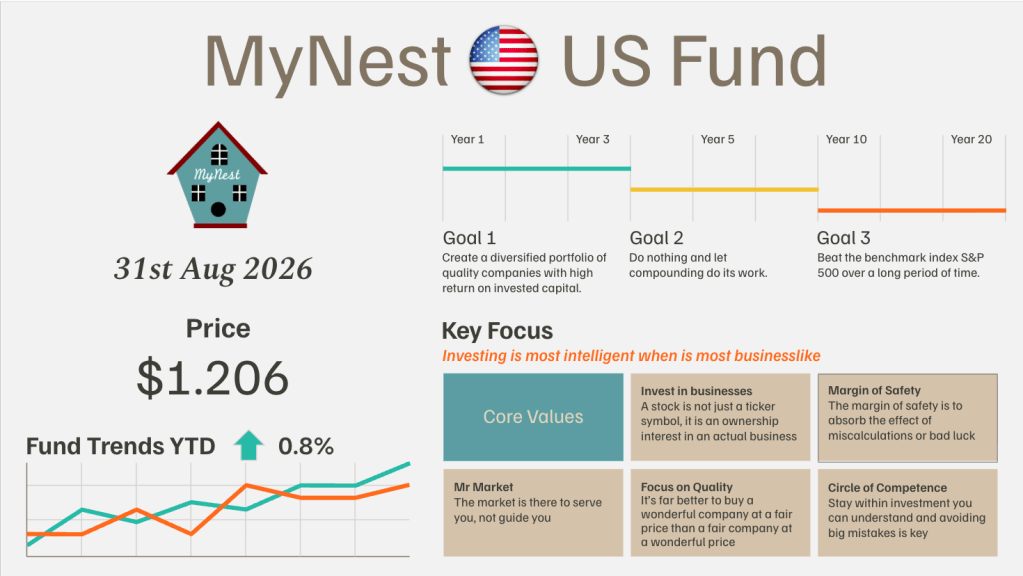
MyNest US Fund Aug 26
The idea behind the “SaaSpocalypse” was simple: if artificial intelligence could write software, generate content and complete business tasks, what would happen to the software companies charging customers to do those things?
-
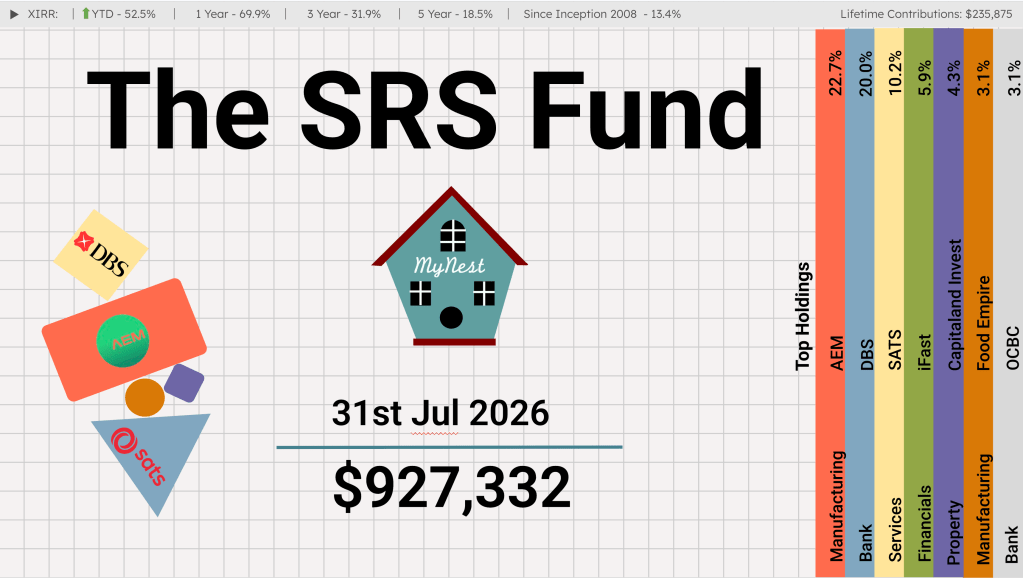
The SRS Fund Jul 2026
For much of 2026, the market’s attention has been firmly fixed on AI, semiconductors and anything connected to the massive build-out in computing infrastructure.
-
MyNest US Fund Jul 26
After spending a long period watching the artificial intelligence infrastructure build-out from the sidelines, we finally decided to join the party—albeit cautiously.

